Learn the Basics of SPC and How to Avoid One of the Hidden Traps
Are you in control? While this sounds like a simple question, in the world of manufacturing, the answer is often quite complex. With so many processes, it’s often difficult to truly know if you are in control. However, there is a well-established methodology that can keep your process on track and help you meet customer requirements.
This article will explain Statistical Process Control (SPC) in Layman’s terms and describe some of the basic tools and steps to follow when performing a process analysis. You’ll also see a real-world example of a critical mistake that’s commonly made when measurement systems are not validated.
What is SPC?
Statistical process control, commonly referred to as SPC, uses statistical techniques to measure, monitor, and control process inputs. Employing this methodology makes it possible to determine if a process is stable and capable. For example, let’s say you are building a deck and cutting planks that need to be 7 feet long +/- .25 inches. To meet the desired outcome, it’s important to know if you are capable of cutting all the boards within the tolerance and if the length of the planks is stable; not drifting away from 7 feet in length.
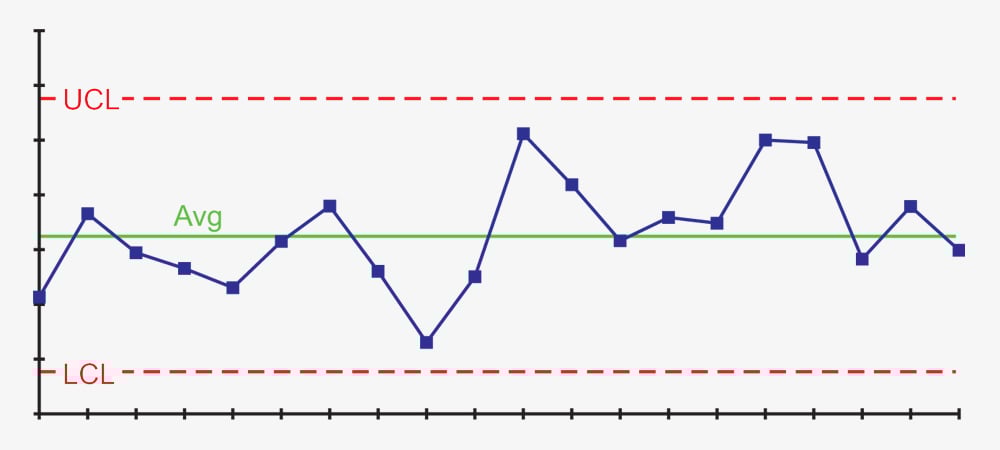
Stability is demonstrated through control charts that show if a process is predictable and consistent.
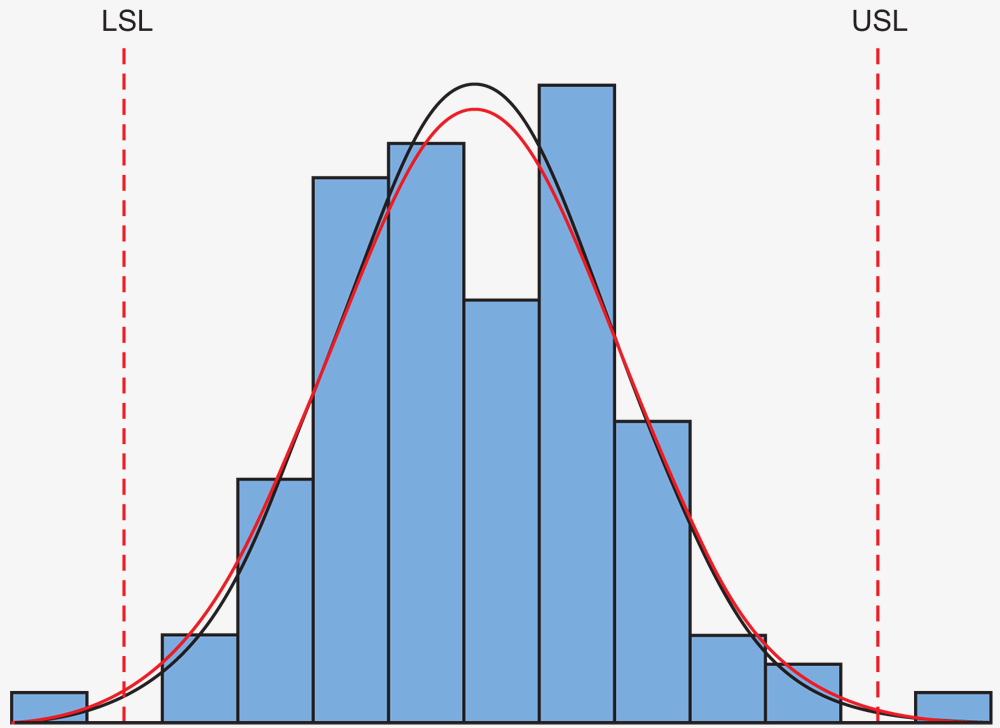
Histograms show capability and if the process can meet customer requirements.
The SPC approach was first developed at Bell Laboratories in the 1920s by Walter Shewhart while he was brainstorming how to reduce variation and improve quality of telephone hardware. He identified two types of variation which are categorized as “common cause” and “special cause.” He recognized that special cause variation was out of the ordinary, could be the result of an assignable cause and was correctable. He defined common cause as the natural variation or “noise” that will continue to exist in a process. To distinguish between the two, Shewhart developed the control chart that earned him recognition as the “Father of SPC.” His technique was not widely used in the U.S. in the first part of the 20th century but became an important tool in post-WWII Japan. Edwards Deming, who was influenced by Shewhart’s ideas, traveled to Japan in the 1950s to teach SPC methods at the invitation of Japanese business leaders. This led to a quality movement that helped Japanese manufacturers succeed and flourish in world markets.
Tools of SPC
As mentioned above, control charts are one of the key tools of SPC and are used to determine if a process is stable. These charts identify if there are any assignable causes that need corrected in a process. If points fall outside of the control limits or violate one of the other control chart rules, this provides a flag showing that analysis and correction of the process is needed. It is important to note the tolerance does not come into play here, rather only the upper and lower control limits are calculated based on the measured data.
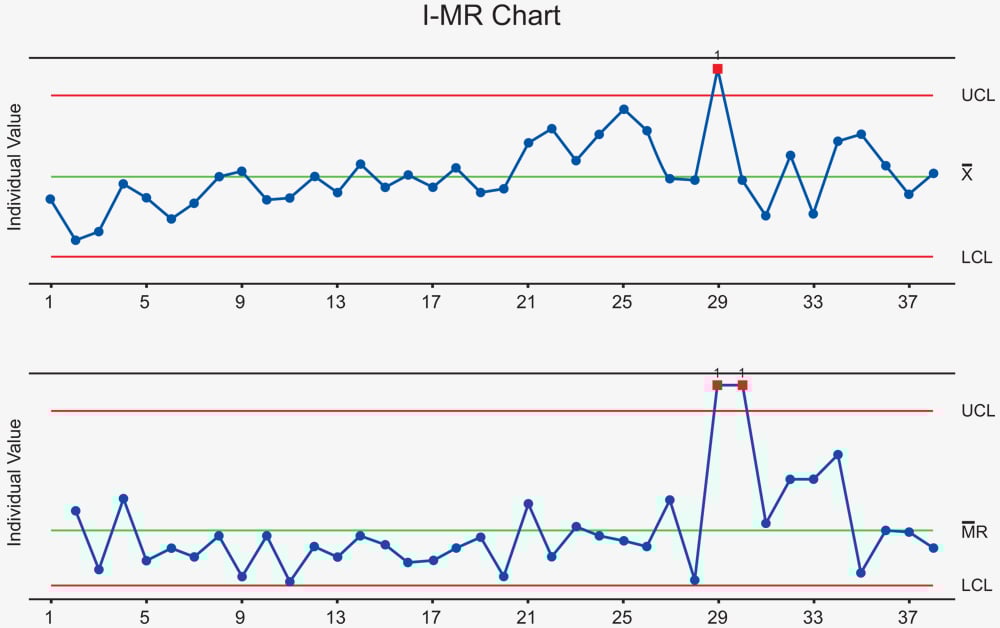
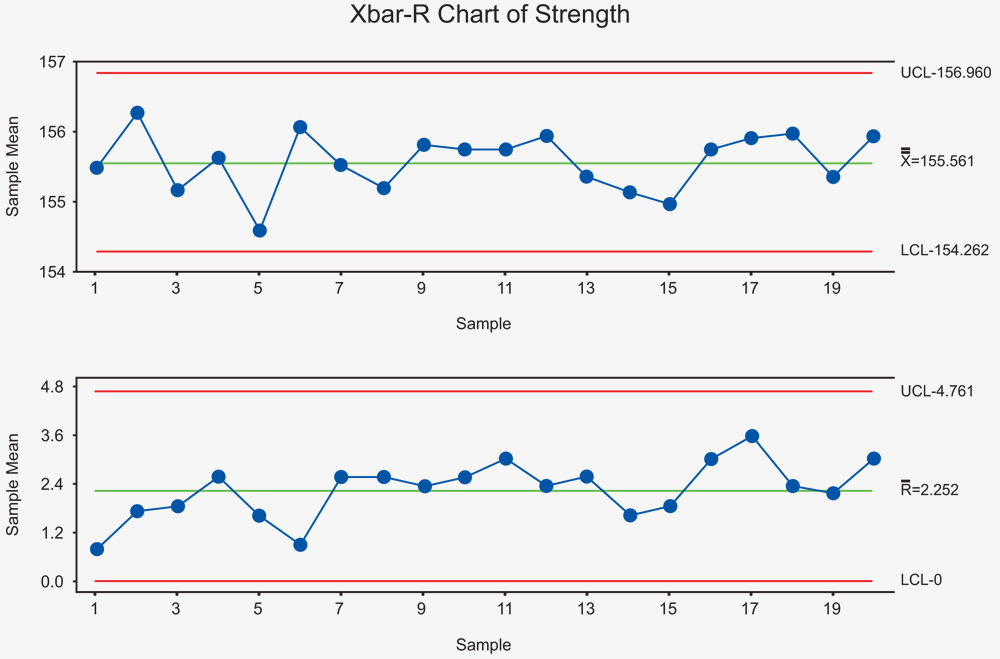
There are different types of control charts depending on the type of data being collected and the sampling plan for collecting data. Two of the common ones are the I-MR chart and the Xbar-R chart.
The I-MR chart plots individual points on the I chart to monitor variation in individual values over time. The moving range between consecutive points is plotted on the MR chart to identify short term variation.
An Xbar-R chart shows how the average of each measured subgroup of parts varies over time compared to the upper control limit (UCL) and the lower control limit (LCL). The R chart shows how the range of the subgroups changes over time compared to UCL and LCL.
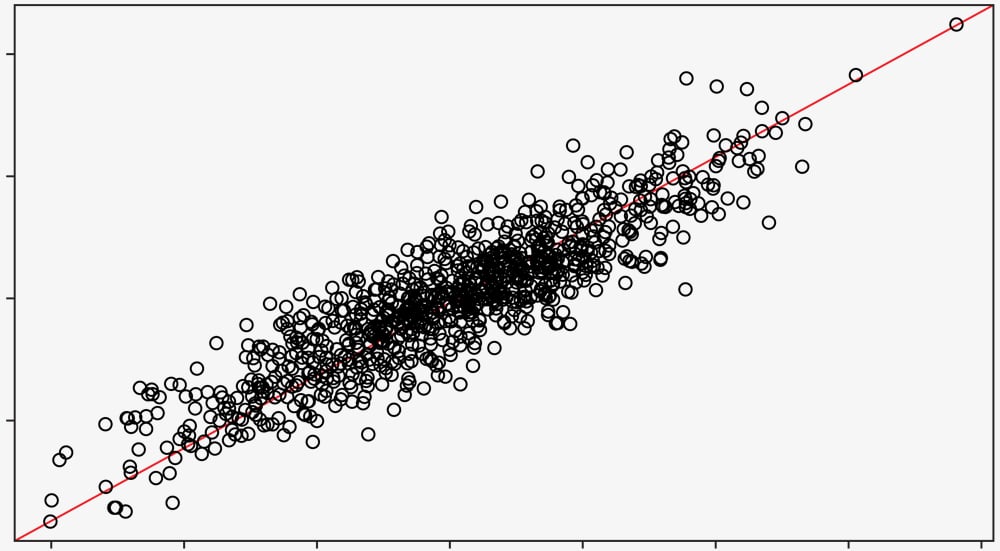
 A scatter plot helps to determine if two variables are related by graphing one variable on each axis and looking for a relationship between them. If they are related, the points will fall along a line or a curve with better correlation indicated by the points more tightly hugging the line.
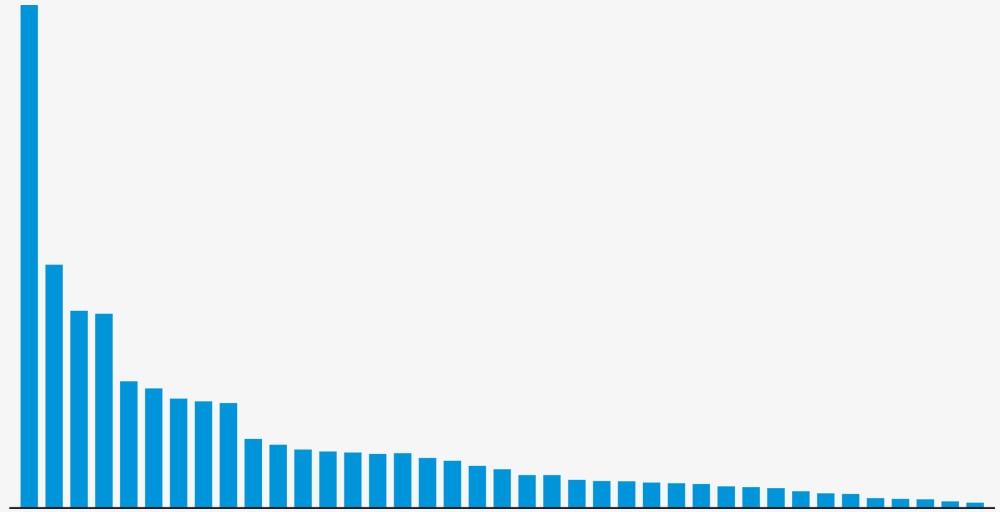
A Pareto chart helps provide focus on the most significant issues to address first. These issues are identified by plots on a bar graph with the lengths of the bars representing frequency or cost and the longest bars arranged on the left in decreasing order to the right. This gives a quick visual of which issues are the biggest problems and where you will get the biggest bang for your buck.
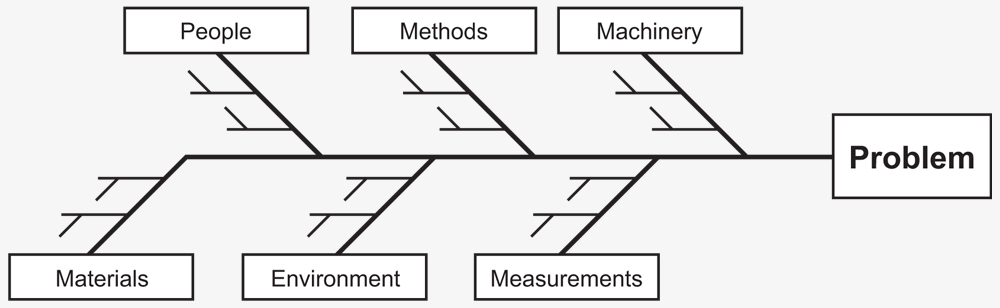 The fishbone diagram, or Ishikawa diagram, helps to identify possible causes for an effect or problem. Often the general headings of methods, machinery, people, materials, measurements, and environment are used to aid in brainstorming the root cause of the problems. This cause-and-effect analysis tool helps to bring out ideas for assignable causes of a problem.
Basic Steps to Perform SPC
- Identify Key Measurable attributes – To meet your customer expectations, it is necessary to understand what product features are important and how the process creates them. Next, identify the attributes which need to be measured and list them in a chart.
- Determine Measurement Method – Think about what level of resolution is needed based on the dimensional tolerance and the effort required. A rule of thumb is to use a measurement method that has a minimum resolution of 10% of the tolerance. Add the measurement method to each attribute listed in the chart to create an SPC plan.
- Perform Gage R&R – This is a critical step that many times is skipped. The repeatability and reproducibility of a measurement system identifies how much of the data variability is due to how it is being measured versus actual variation in the part. This not only considers the resolution of the measurement system, but also the influence of the person using the gage. A Gage R&R of less than 10% indicates a good measurement system, with 10%–30% pointing to a questionable system that needs reviewed.
- Decide on Sampling Plan – Sub groups should be formed by organizing the parts into groups that were manufactured under the same conditions. This allows for comparing the variation between groups instead of part to part. The variation within each sub group is the inherent variation in the process. There are times when the best plan is a sub group size of one.
- Collect Data – Measure and record part data based on the established sampling plan. It’s important to stay organized and follow the documented plan. It takes a lot of time and effort to inspect attributes of a part and no one wants to hear the words “we need to start over.”
- Create and Analyze Control charts – There are many good tutorials available that detail the formulas for calculating the upper and lower control limits and how to plot the data on the control charts. In addition, there are many software packages that do the calculations and plot the data automatically. Some examples are QC-CALC, Minitab, PiWeb, WinSPC, SPC for Excel, and Enact, to name a few. Compare the points on the control chart to the upper and lower control limits to determine if the process is stable and in control. There are basic rules to follow in the analysis of the control charts that determine if there is special cause variation in the process that needs to be corrected. For example, if a point falls outside of the control limits or if more than seven points in a row are above or below the mean, then the process is not in control.
- Find and Correct Assignable Causes (if not in control) – Using the tools described earlier, assignable causes can be found and corrected when there is special cause variation in a process. If the rules for the control charts only indicate common cause variation, then the process is in control and you can move to the next step to determine if the process is capable of meeting your customer’s requirements.
- Calculate Cp and Cpk – The Process Capability Index (Cp) is calculated by taking the print tolerance for an attribute divided by six times the standard deviation based on the R chart. If Cp=1 or greater, then the process is capable of producing parts within the tolerance defined by the upper specification limit (USL) and the lower specification limit (LSL). Keep in mind, this does not consider if the process distribution is centered around the mean of the print tolerance. Imagine if you were target shooting and your shots were all clustered tightly together, but not near the center of the bullseye. This data could represent a good Cp value. But there is more to the story, especially if you were intentionally aiming for the bullseye.


Now imagine if your shots were clustered around the center of the bullseye. The Process Capability Index (Cpk) reveals if the data is clustered together, but also considers if the distribution is close to the center of the tolerance. Cpk is calculated by taking the difference between the process average and the nearest specification limit and dividing by three times the standard deviation. This calculation is repeated for the other specification limit and the minimum value of the two calculations is the resulting Cpk. A target of Cpk=1.33 or greater is typically used and gives confidence that the process will produce all parts within the part tolerance. Some customers require even higher standards such as a Cpk=1.67 or greater. It is important to point out there can be significant manufacturing costs required to design a process that can achieve such an elevated result. The cost/benefit equation should be carefully considered when specifying Cpk requirements.
Avoid a Hidden Trap
Let’s say, you have just spent hours inspecting multiple dimensions on one hundred parts. A good sampling plan of twenty sub groups of five parts each was defined. The Xbar-R chart was created from the data and there were a couple of points outside the control limits indicating the process is not in control. You know that you’ll need to use some of the SPC tools to identify root causes so corrections can be made to the process. Your team spends a couple of days working through this only to find out the inspection method is the cause of the excessive variation in the data. The critical step of conducting the Gage R&R was skipped. This is a costly mistake. Days have been wasted looking for a problem in the machining process that did not exist and, now, all the parts need to be inspected again with an improved measuring system that passes the Gage R&R.
Darron Horsley, Makino’s Application Engineering Manager, has seen this scenario happen more than once with inexperienced customers. He described one customer that purchased a new CMM as well as a custom fixture for inspection of parts in their plant. They did not perform a Gage R&R and were surprised by the failed runoff data after the same machining process had been successfully run at Makino’s facility. The custom fixture located the parts on the datums to save inspection cycle time and the CMM touched off on all the points needed to collect dimensional data. Makino engineers were able to determine the parts were not loaded consistently on the fixture with the part positioned correctly on the datum locators. This was the step which was introducing variation into the data. Darron described it this way, “It’s like tossing a softball in a sand trap. You’re not sure exactly where it will come to rest.” Makino recommends a fixture that holds the part with the datums exposed to allow the CMM to pick them up in the inspection process. This adds some time, but minimizes the variation during inspection; resulting in a satisfactory Gage R&R.
Tap into SPC Experience
There are many good resources on the internet and numerous books written about the details of statistical process control methods and how to use them. The International Association for Six Sigma Certification (IASSC) and the Council for Six Sigma (CSSC) sets standards for Lean Six Sigma training where individuals can attain Yellow, Green, or Black Belt certifications. The American Society for Quality (ASQ) provides training, publications, and conferences that can advance your understanding of the topic. In addition, many community colleges offer courses that provide workforce education on SPC.
Makino brings decades of experience with a large application engineering staff and quality engineering professionals who understand statistical process control. This has been demonstrated through hundreds of successful turnkey projects and direct support of our customers. A full metrology lab at Makino’s North American headquarters in Mason, Ohio, is utilized by experienced engineers with the know-how to deliver a stable and capable process. That’s why Makino can guarantee Cpk results on critical features of a turnkey.
Watch this informative
webinar “Makino Turnkey – A Proven Path to Production” to learn more about Makino’s turnkey capability.